Insights from 2020 turnout patterns among Latino voters in Maricopa County, Arizona and Miami-Dade County, Florida
By: Ben Lazarus and Joe Garland
In honor of National Hispanic Heritage Month, TargetSmart is diving back into our voter data on the 2020 general election, with a couple specific, local looks at the impacts of the Latino vote in last year’s historic elections. In April, the folks at Equis Research released an insightful report on the Latino vote in 2020, and we’d like to dig in on two big picture takeaways from their work (which can be accessed in full here).
“Latinos were a critical part of the Democratic coalition that won the White House and Senate. There are several states that Joe Biden and Senate Democrats won with the help of Latino voters, and there are none they lost because of them.”
“Still, Trump and the GOP actively campaigned for the Latino vote and made gains that cut across geography and place of origin. In South Florida, the gains were enough to flip congressional seats. But questions remain about the nature of the shift, which will take yet more time to unpack.”
Using TargetSmart’s voter file resources, we dug into these macro-level findings at the local level to look specifically at turnout patterns among different blocs of Latino voters in two key Latino-dense swing counties: Maricopa County, Arizona (home to Phoenix and its suburbs) and Miami-Dade County, Florida.
Maricopa County
President Biden won the state of Arizona and its 11 electoral votes by about 10,000 votes in the 2020 general election. Biden won Maricopa County by about 45,000 votes. In 2020, over 2 million people voted in Maricopa County.
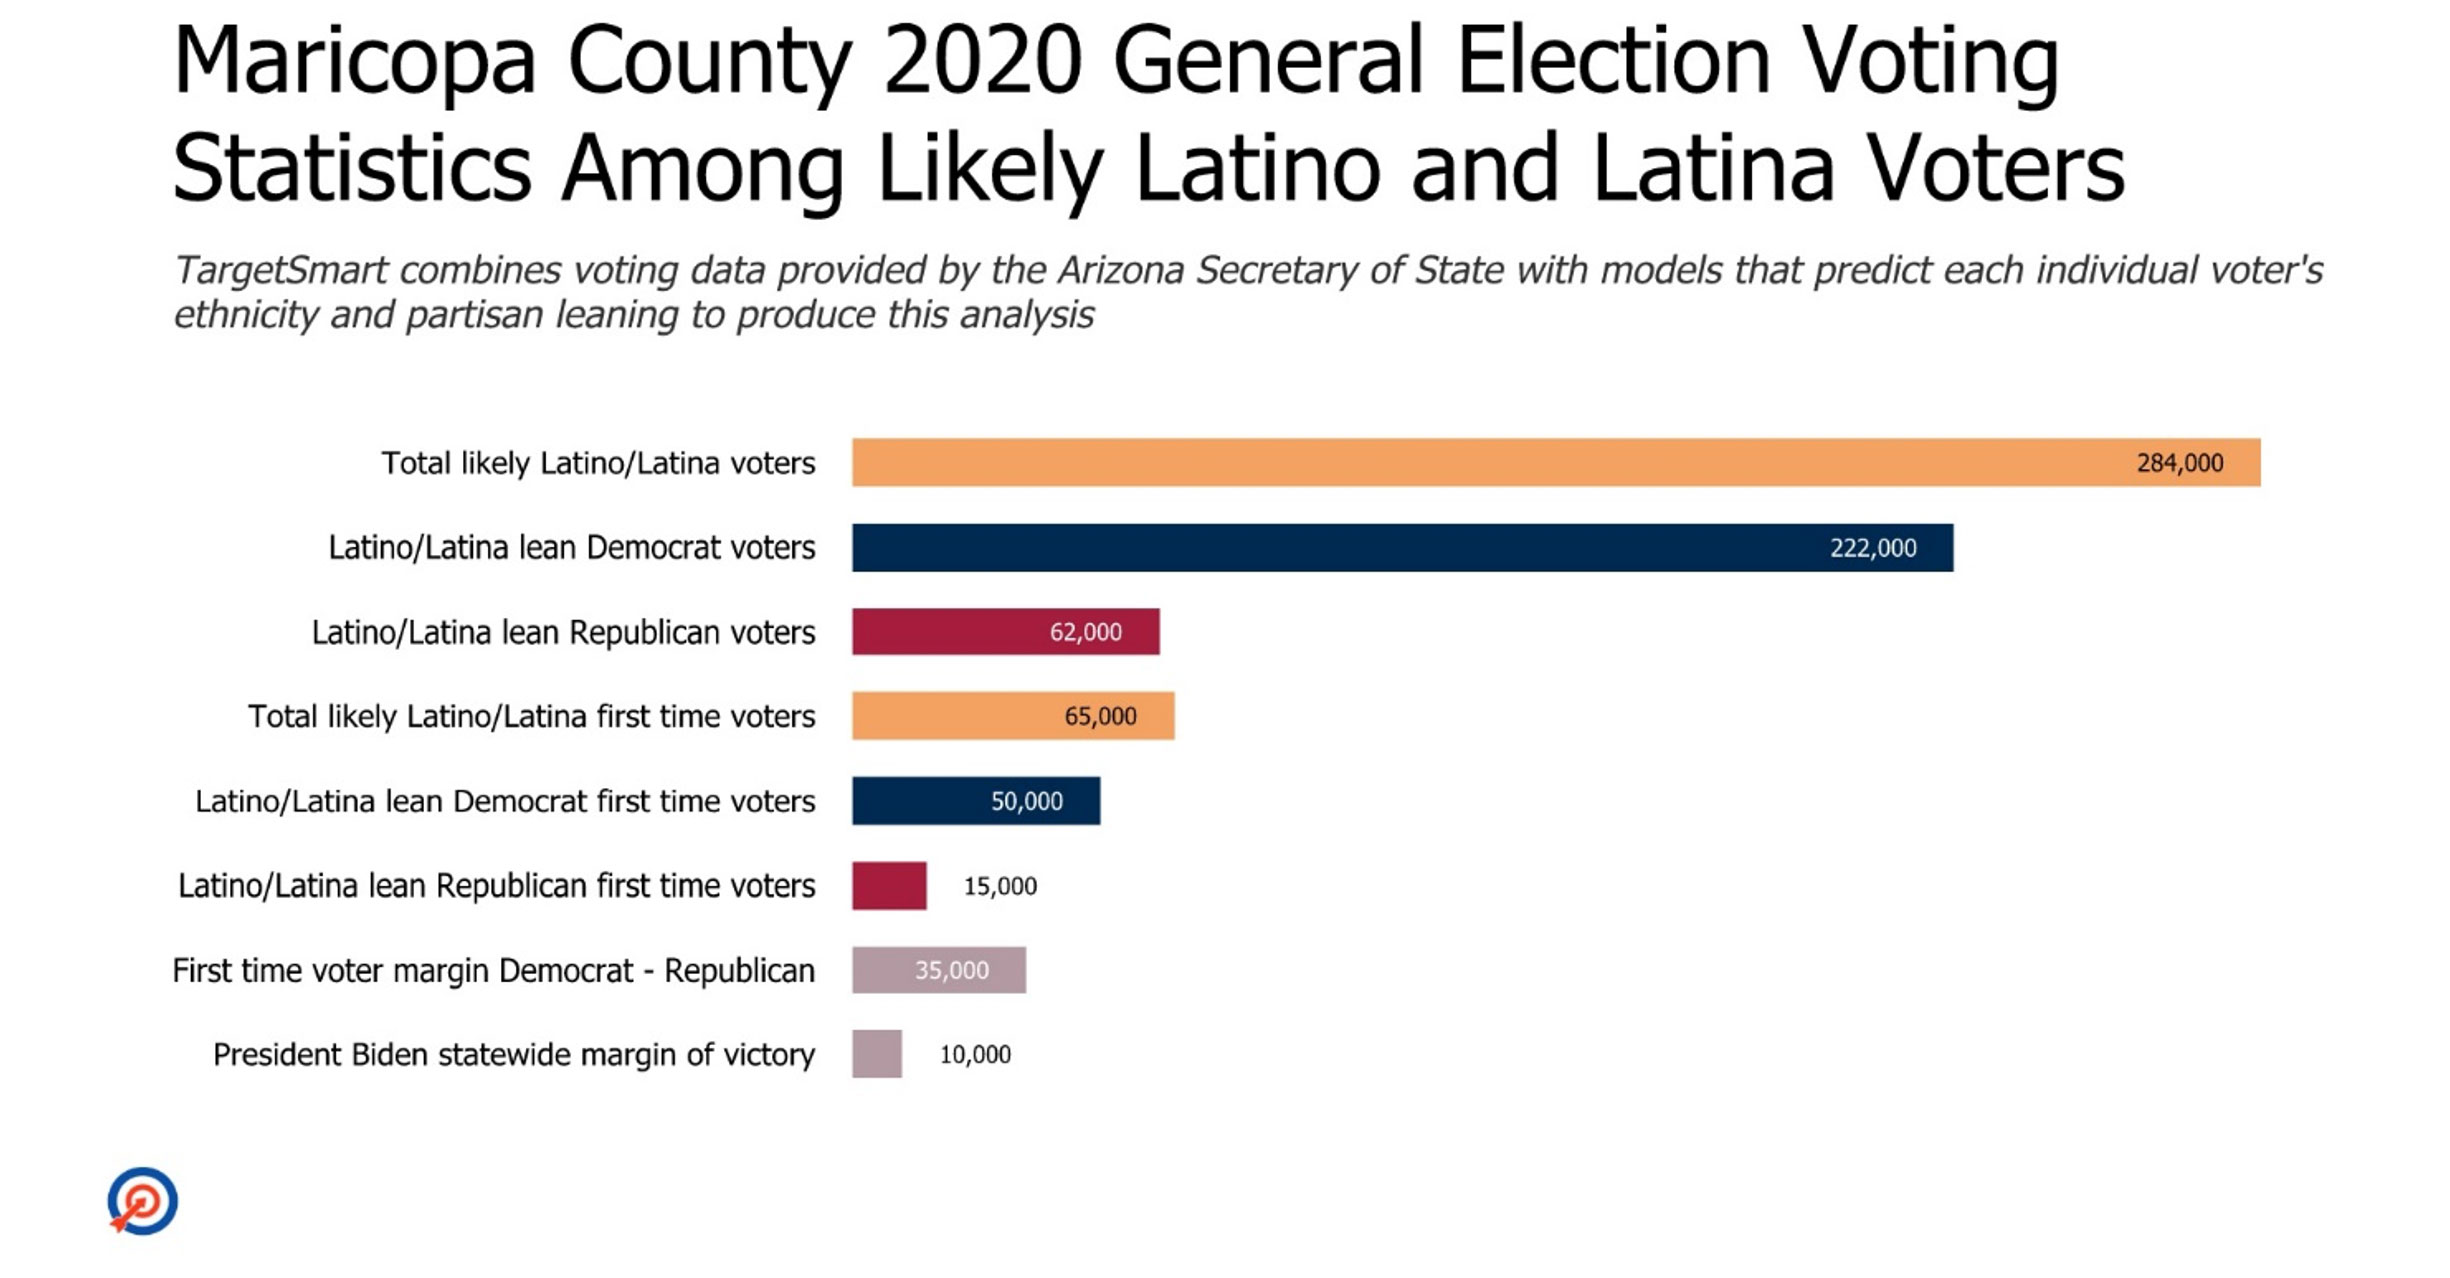
Using our models for both race and partisanship we have identified at least 284,000 Latino votes cast in Maricopa County in 2020. Of those voters, roughly 222,000 leaned Democratic and roughly 62,000 leaned Republican meaning, by our estimates, President Biden conservatively netted roughly 160,000 votes over Trump in Maricopa County’s Latino community.
We found that there were about 138,000 Democratic leaning registered Latino voters in Maricopa County who had never voted in an election prior to 2020. This bloc of voters turned out at a rate of 37 percent in the 2020 general election, accounting for roughly 50,000 Democratic leaning first time Latino voters in Maricopa County. In comparison, there were only about 36,000 Republican leaning registered Latino voters in Maricopa County who had never voted in an election prior to 2020, and while they participated at a slightly higher 42 percent rate in the general election, this only represents about 15,000 first time Republican leaning Latino voters in Maricopa County in 2020.
As such, President Biden likely netted roughly 35,000 votes over Trump among new Latino voters alone, a total that is more than three times the President’s winning margin in the state.
Miami-Dade County
Donald Trump won the state of Florida and its 29 electoral votes by about 372,000 votes statewide.
President Biden won Miami-Dade County, but by only about 85,000 votes, a much-discussed underperformance relative to Hillary Clinton who won Miami-Dade County by roughly 290,000 votes in the 2016 election. Still, as Equis notes in its report, “even if Biden had matched Clinton’s performance in Miami-Dade County and the Rio Grande Valley, he still would’ve lost both Florida and Texas handily; the underperformance in those states was not limited to Latino voters.”
Even though the shift in Miami-Dade was not determinative of statewide victory or defeat, the profoundly negative impacts it imparted on Democrats down-ballot in 2020 and the concerns it raises about potential for future statewide victory continue to beg the question: what happened in Miami-Dade in 2020?
To level set, the huge, and politically conservative, Cuban community in Miami-Dade makes it one of the least Democratic leaning majority-Latino communities in the country. In fact, among Latino voters in Miami-Dade, registered Republicans (~333,000) actually outnumber registered Democrats (~293,000) by about 40,000 voters. However, there are over 350,000 unaffiliated Latino voters in Miami-Dade, registered with neither major political party.
To help us better understand the totality of the Latino electorate in Miami-Dade, we must also look at them through the lens of partisan modeling, and with this tool we predict a narrow Democratic advantage among all registered Latino voters of about 570,000 lean Democrats to 407,000 lean Republicans.
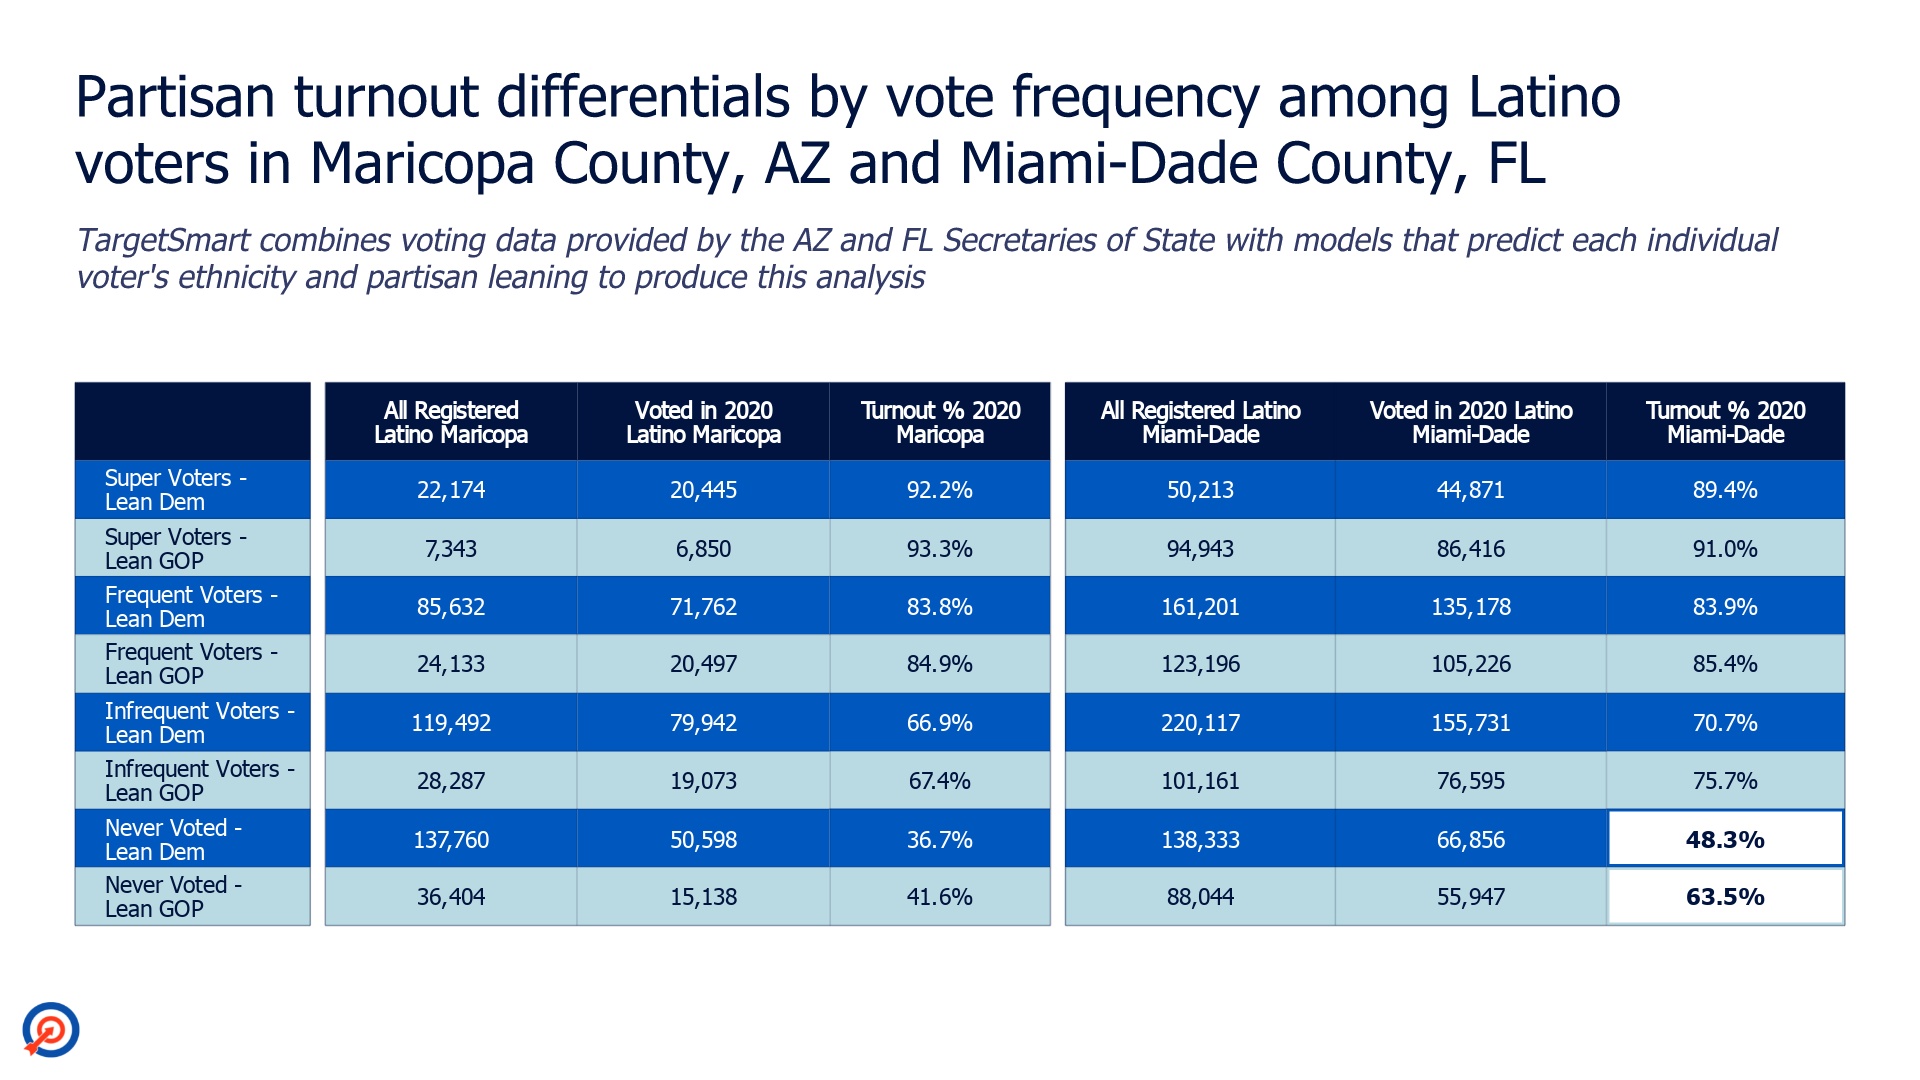
Our data suggests that this registration advantage was likely nullified by a substantial partisan turnout differential that materialized among Latino voters in Miami-Dade County in 2020. The roughly 570,000 lean Democratic Latino voters in Miami-Dade County voted at a rate of 70.7% in 2020 while the approximately 407,000 lean Republican Latino voters in Miami-Dade County voted at a rate of 79.6%.
Turnout among lean Democratic Latino voters was lower than GOP turnout rates among all types of voters, but the partisan gap in the rate of participation in the election was particularly pronounced among first-time voters in Miami-Dade County. Nearly two-in-three (63.5%) Republican leaning Latino voters who had never before voted in an election turned out and voted in 2020. Comparatively, just under half (48.3%) of Democratic leaning Latino voters in Miami Dade County who had never before voted in an election turned out and voted in 2020.
As shown in the figure below, turnout rates among lean-Republican Latino voters outpaced turnout rates among lean-Democratic Latino voters among every type of voter (super voters, frequent voters, infrequent voters, and those who had never voted), and in both counties we investigated.
However, what stands out is the significant energy and apparent motivation to participate among Republican leaning new and low-propensity Latino voters in Miami-Dade County, as does the fact that the partisan differential in turnout rate between lean Democrats and lean Republicans is wider for every category of voter in Miami-Dade than it is in Maricopa. In Maricopa County, the turnout rate differential was narrower between lean Democratic and lean Republican Latino voters.
What’s more, our data indicates that out of a pool of about 174,000 Latino voters who had never voted in an election prior to 2020 in Maricopa County, Democrats were able to net approximately 35,000 new votes, while in Miami-Dade Democrats were only able to net approximately 12,000 new votes out of a larger pool of roughly 226,000 Latino voters who had never voted in an election prior to 2020.
Key takeaways:
- In Maricopa County, Democrats capitalized on a fast-growing, Democratic leaning Latino electorate, and those voters participated in numbers that probably tilted the overall outcome of the election. There are far fewer GOP leaning Latino voters in Maricopa County, and they turned out at rates only marginally higher than their lean-Democratic counterparts.
- In Miami-Dade County, Republicans capitalized on their built-in advantage among a more conservative leaning Latino electorate while growing their base by successfully mobilizing a high proportion of new Republican voters and infrequent Republican voters. Democratic leaning turnout lagged behind GOP leaning turnout, particularly among lower propensity voters.
- Don’t expect to stop hearing the term “the Latino vote is not a monolith” any time soon. Analysis after analysis, including this one, prove it to be true. Better understanding the complexities of how candidates and causes resonate with this diverse and growing group in different parts of the country will continue to be a critical task for organizers, advocates, researchers, strategists, and program funders moving forward.
Note on Methodology: TargetSmart compiles publicly and commercially available data on voters. We use sophisticated computing tools alongside various inputs from our big data warehouse to produce individual-level models that help us predict which party each voter is likely to affiliate with and how likely they are to vote at all in any given election. We also make individual level predictions about each voters’ race and ethnicity. This data is more reliable in some states than others. (In a place like Florida -- and across much of the south -- voters indicate their race on their voter registration form.) Generally speaking, the models undercount minority communities when compared to analogous census data. As such, all of the projections referenced in this post about Latino voters in Maricopa County in particular are conservative by nature. Accordingly, the reality of the impact of the Latino community’s voting power in Maricopa County in 2020 is almost certainly bigger in magnitude than reflected here.
Ben Lazarus is TargetSmart’s pollster and Director of Research Solutions. Joe Garland is TargetSmart’s Sr. Data Scientist. TargetSmart’s polling team has conducted extensive Latino research over the last two years in Arizona, Florida, Georgia, North Carolina, Texas, and Virginia, working closely with Equis Research as one of their core polling and analytics partners.